
Operational efficiency improvement means getting more output from the same input, or the same output from less. The reliable route is simple: measure what goes in and what comes out, map how the work actually flows, fix the biggest constraint first, then track the result and repeat. Below is how to do each step in a New Zealand organisation, with the measures, methods and traps that matter.
TL;DR
- Efficiency is a comparison of inputs (money, people, time) with outputs (volume, quality, customer service). Measure both before you change anything.
- Map the process with the people who do the work. Mapping exposes bottlenecks, rework and waiting that dashboards hide.
- Choose a small number of measures tied to what customers value, and fix the constraint with the highest impact first.
- Small, steady changes beat big overhauls, and they stick when your team is trained in a common method.
- Automation helps most after the process is clear, not before.
Table of Contents
- What operational efficiency actually means
- Find where the inefficiency lives
- A step-by-step plan to improve operational efficiency
- Set targets and KPIs without drowning in data
- Where automation and digital tools fit
- Make the gains last: people, leadership and training
- Our perspective
- How Klicx can help
- FAQ
- Sources
What operational efficiency actually means
At its simplest, operational efficiency is the relationship between what a business puts in and what it gets out. Business.govt.nz explains that you can measure it by comparing operational inputs and outputs. Inputs can come from stocktakes or your financial statements. Outputs include how much product or service you produce, plus attributes such as product quality and customer service.
That last point matters. An organisation that cuts cost by letting quality slide has not become more efficient, it has moved the cost somewhere else, usually to rework, complaints or lost customers.
The same source describes three ways an efficiency gain shows up:
- The same output from less input, which cuts cost.
- More output from the same input.
- Much more output from only a little more input, which grows the business.
Business.govt.nz also notes that improving efficiency is about incremental changes rather than radically changing the operation. That is good news for a manager without a transformation budget: you do not need a big programme to start.
How to calculate it
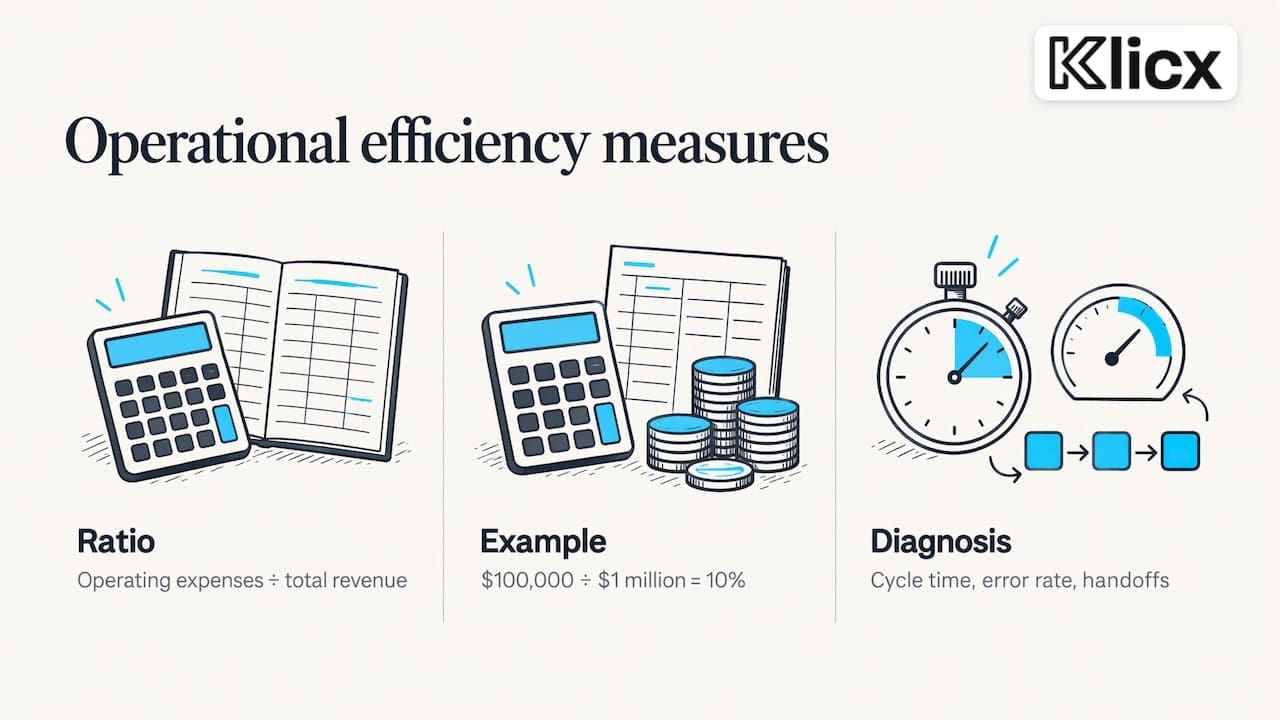
There is no single universal formula, so pick one and stay consistent. The most common financial measure is the operational efficiency ratio. NetSuite calculates it as operating expenses divided by total revenue, and lists cost per unit, cycle time, defect rate and resource utilisation as common operational metrics. DeskTime uses a variant, operating expenses plus cost of goods sold divided by net sales, and says a lower ratio generally means revenue is being generated more efficiently, provided quality stays high.
A worked example from ProjectManager: operating expenses of $100,000 against annual revenue of $1 million gives a ratio of 0.1, or 10 percent. If you can hold revenue and reduce that expense, the ratio falls and you are earning the same money more cost-effectively.
The ratio is a scoreboard, not a diagnosis. It tells you whether things are getting better, not where the problem sits. For that you need process-level measures such as cycle time, error rate and handoffs.
Find where the inefficiency lives
Most organisations already have a good guess about where the waste is. The guess is often wrong, because the biggest delays sit between teams rather than inside them. Process mapping makes those gaps visible.
Map the process
Business.govt.nz says process mapping can help identify bottlenecks and other capacity problems, inventory build-ups or shortages, quality problems and other opportunities for improvement. It can also show the time or materials a change would save, and expose flow-on effects before you commit to a change.
A practical way to run it, drawing on the approach set out by the UC Berkeley BPM Portal:
- Walk the process with the people who do the work, not just their manager.
- Classify each step as value-adding, non-value-adding, or necessary for the business but not valued by the customer.
- Look for waste using the TIMWOODS checklist: transportation, inventory, motion, waiting, overproduction, overprocessing, defects and unused skills.
- Record baseline numbers: cycle time, number of steps, handoffs and error rate.
- Prioritise the waste with the highest customer impact and the most realistic path to removal.
Step 4 is the one people skip, and it is why many improvement projects cannot prove they worked. Without a baseline, a better process is just an opinion.
Use a value stream map for flow
For work that moves through several stages, a value stream map shows the whole flow of materials and information. NIST describes it as often the first step in identifying waste and shortening lead times, with four stages: identify the value stream, draw the current state, diagnose problems and define a future state, then implement the improvements. NIST’s page is written around manufacturing, but the logic carries to quoting, onboarding, claims, procurement and any other repeatable service process.
Find the single constraint
Every process has one step that limits how much gets through. Improving anything else just builds a bigger queue in front of it. The principle is easy to see in a small workshop, and the walk-through on finding workflow bottlenecks shows how mapping the job lifecycle reveals the one stage holding everything up. The same thinking applies in an office, a warehouse or a clinic.
A step-by-step plan to improve operational efficiency
Here is a sequence that works for a team of 20 or an organisation of 2,000. It follows the advice from Business.govt.nz to define metrics that fit what customers value and to use process mapping to study how the business works.
1. Define what “better” means to your customer
Start outside the building. What does the customer notice: speed, accuracy, price, communication? Choose measures that reflect that. A fast process that produces wrong answers fails the test.
2. Set your baseline
Collect current inputs and outputs for one process, not the whole business. Pick the process that is most visibly painful or most costly. Record the ratio, cycle time, error rate and the headcount or hours involved.
3. Map and diagnose
Run the mapping session described above. Keep it cross-functional. NIST notes that cross-functional teams help build teamwork, boost morale and make sure all vital areas are accounted for, and that different areas will weigh priorities differently: biggest reduction in lead time, biggest impact on the customer, highest chance of success.
4. Choose a few improvements
The Massey Business School BusinessFirstNZ report advises prioritising improvement areas against strategic goals and available resources, assigning clear responsibilities, and following up in regular meetings. Three well-owned fixes beat fifteen orphaned ones.
5. Pick a method and apply it
You do not need to invent a method. The NZQA skill standard on analysing operational issues and applying continuous improvement techniques lists the established toolkit: Total Quality Management, Kanban scheduling, the PDCA cycle (plan, do, check, act), Kaizen, the DMAIC model (define, measure, analyse, improve, control), benchmarking and continuous feedback loops. Which one fits depends on the problem:
| Situation | Method that tends to fit |
|---|---|
| Variation and defects in a repeatable process | DMAIC (Lean Six Sigma) |
| Delays, waiting and handoffs | Value stream mapping, Lean |
| Small, frequent fixes owned by the team | PDCA, Kaizen |
| Work piling up unevenly | Kanban |
| Whole-organisation direction and capability | A framework such as EFQM |
6. Lock it in and measure again
Re-measure against the baseline after the change, then hand the measure to a named owner. Improvement that nobody owns drifts back within months.
Set targets and KPIs without drowning in data
The common failure is tracking too much. One practitioner view, from ChiefViews, is to select five to seven core metrics, set baselines and targets, hold weekly reviews focused on two or three of them, and run a deeper monthly review. That is a sensible rhythm for most teams.
Group your measures so nothing important is missed:
- Process: cycle time, throughput, first-pass yield.
- Cost: cost per unit, operating margin, inventory turnover.
- Quality and customer: defect rate, on-time delivery, satisfaction score.
- People: engagement, turnover, output per head.
Balance matters. If you track cost alone, quality quietly suffers. A pairing such as cost per unit alongside defect rate keeps both honest.
The Massey report also stresses regular self-assessments and health checks to identify strengths and gaps, and benchmarking against good practice. An independent assessment against a recognised framework is a way to get that outside view, and it is where we often begin with clients.
Where automation and digital tools fit
Technology multiplies whatever process it is applied to, good or bad. Automate a confused process and you get confusion faster.
Once the process is clear, the gains can be real. The Massey report notes that machine learning and robotic process automation can automate routine tasks and analyse large datasets, freeing people for more strategic work. In practice the first candidates are usually re-keying data between systems, approvals that wait in inboxes, and reports assembled by hand.
If you are weighing this up, our guides to digital workflow solutions and data integration services explain what to buy and how to scope it.
Make the gains last: people, leadership and training
Efficiency projects rarely fail on the technical side. They fail when the team that has to run the new process was never part of designing it, or when the leader who sponsored it moves on to something else.
The Massey report states that high-performing organisations emphasise leadership, staff training and resource allocation, and that business excellence takes ongoing commitment and deliberate action from all stakeholders. Three habits follow:
- Give staff a shared method. When everyone uses the same language for waste, variation and root cause, improvement stops depending on one enthusiastic person.
- Equip sponsors. Leaders who understand the method remove blockers instead of creating them.
- Build it into the week. Short, regular review meetings with named owners keep progress visible.
For more on choosing outside support, see our article on organisational effectiveness consulting.
Our perspective
We see the same pattern in New Zealand organisations of every size. Leaders know something is slowing them down, but the strategy is unclear, the process is undocumented and the team has no common method for fixing it. Buying software or running a one-off cost-cutting exercise treats the symptom.
That is why we combine three things: assessment, capability building and practical implementation support. Assessment against the EFQM framework shows where you stand and what to fix first. Training in methods such as Lean Six Sigma gives your own people the confidence and skills to keep improving after we have left. Implementation support, including digital solutions for workflow and systems integration, turns the plan into changed work.
Our approach is built around a New Zealand perspective and the whole improvement journey, from strategic assessment through to training and deployment. If you do only one thing this quarter, baseline one process and map it with the people who do the work. You will learn more in a single afternoon than in a month of reports.
Jeremy
How Klicx can help
If you want an independent view of where to start, our business assessment gives you an improvement roadmap. For hands-on support across consulting, innovation, project management and digital work, see what we do.

If you would rather build the skills in-house, our courses are priced per person, with published starting prices:
| Course | Price |
|---|---|
| Lean for Leaders, Sponsors and Champions | from $495 NZD |
| Lean White Belt Optimisation Foundation | from $795 NZD |
| Lean Six Sigma Yellow Belt | from $1500 NZD |
| Lean Six Sigma Green Belt | from $3345 NZD |
| EFQM Foundation, Fast Track | from $795 NZD |
| EFQM Foundation, In-Depth | from $1500 NZD |
A common pairing is a sponsor on the Lean for Leaders course and a project lead on the Green Belt, so the person running the improvement and the person backing it speak the same language.
FAQ
How do you calculate operational efficiency?
Compare outputs with inputs. The usual financial version is the operational efficiency ratio, operating expenses divided by revenue, so $100,000 of expenses on $1 million of revenue gives 10 percent. Pair it with process measures such as cycle time and error rate so you can see why the number moves.
What is the first step to improve operational efficiency?
Baseline one process. Record its inputs, outputs, cycle time and error rate, then map it with the people who do the work. This shows where the bottleneck and the waste are, and it gives you a before figure to prove the improvement against.
Do we need new software to become more efficient?
Not as a first move. Most gains start with clearer processes and ownership. Once the process is understood, automation and system integration can remove manual re-keying and approval delays, and the case for the investment is much easier to make.
Which method should we use: Lean, Six Sigma or something else?
Match the method to the problem. Lean targets waiting and handoffs, Six Sigma’s DMAIC targets variation and defects, and PDCA suits small, frequent fixes. Many organisations combine them, and a framework such as EFQM helps decide which areas deserve attention first.
How long does it take to see results?
Small changes to a single process can show in your measures within weeks, because the work is incremental. Lasting gains depend on owners, regular reviews and trained staff, so plan for ongoing follow-up rather than a one-off project.
Sources
- Operational efficiency and innovation, Business.govt.nz
- Process mapping, Business.govt.nz
- What Is Operational Efficiency? NetSuite
- How to Measure Operational Efficiency, DeskTime
- Operational Efficiency Improvement, ProjectManager
- Assess, UC Berkeley BPM Portal
- Value Stream Mapping, NIST
- Shop Workflow Bottlenecks, Fettle Bay Blog
- In Pursuit of Business Excellence, Massey Business School
- NZQA skill standard 40914
- Operational Excellence Metrics Every COO Should Track, ChiefViews
Recommended
- Organisational Effectiveness Consulting: What It Is and How to Choose
- Digital Workflow Solutions: A Practical Guide for NZ Organisations
- Data Integration Services in NZ: What to Buy and How to Scope It
- Business Improvement
This article was produced with AI assistance and reviewed for accuracy. It is provided for general information only and is not professional advice.